Once you have determined your clusters (or segments) for your data – which may take some time to find the best approach – you may have the issue of new observations. In the case of marketing and segments, you may have a new customer and you will probably want to classify the customer to a segment based upon their information.
You have two courses of action in this situation:
- To add the new customer/s to your overall data and then re-run cluster analysis for the entire database (again), or
- To classify the customer into a segment based upon the existing segmentation structure using the means (averages) of the cluster variables.
Which approach is best?
It depends upon the size of your database and the number of new customers that you are adding. Certainly there is significant effort and thought required in identifying logical market segments using cluster analysis, so this is not a process that you would want to undertake frequently.
And in addition to the time and effort, if the profile of new customers is reasonably different to the make-up of your existing customers, then you might find that the overall segmentation approach may need to be revised, resulting in existing customers needing to be reclassified into new segments. This is not ideal as it may also affect the marketing mix efforts targeted towards your various segments.
Therefore, as new customers are acquired, it is recommended that they are classified into existing segments based upon the current segmentation approach. Then, as a rough rule-of-thumb, whenever new customers exceed 20% of the overall customer database (since the last segmentation review) that it would be worthwhile reviewing your segments using cluster analysis. This would mean that fast growing companies would need to undertake this review more frequently that firms with stable and loyal customers.
How should new customers be classified?
You can classify new customers to their most appropriate segment/cluster based upon the variable means (averages) that you would have constructed previously.
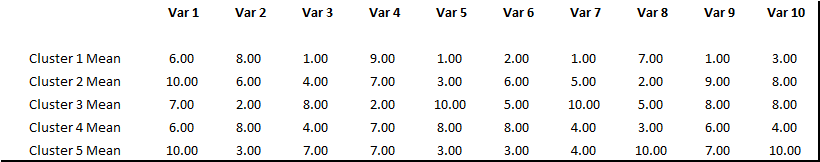
For example, let’s say you had the following five segments that you had determined using ten variables.
Then you had three new customers acquired by the firm as follows. As you can see, you are able to determine their scores for each of the ten variables as it fits into customer database information.

We then need to look at each new customer (observation) to see which cluster it best fits into. The data, in this example, is rounded to make it simpler – but imagine that most data is a little more jumbled, so we need a simple formula on Excel to work out the best segment for the new customer.
In this case we will use =SUMXMY2, which is a built-in formula for Excel. This allows us to sum the squares of difference between each variable between the cluster mean and the new customer data. This is a very quick and efficient formula to use. In this example, you would end up with something like this outcome in Excel.
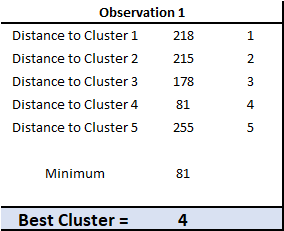 As you can see, we need to calculate the sum of squares difference (using =SUMXMY2) for the new customer data (observation 1) against EACH segment that we have previously determined (five clusters in this example).
We then simply find the closest fit by finding the minimum distance (sum of squares difference) – which in this case happens to be Cluster 4.
Free Excel Template for Allocating New Customers
Here is a free Excel template to download for this segment allocation process. It contains the ability to have five segments, ten variables and three new customers (as a time). If you want to further modify the template for your purposes, the password is “cluster“.
Find the right segment template (Free Excel template).
Related Information