Interpreting the segmentation map
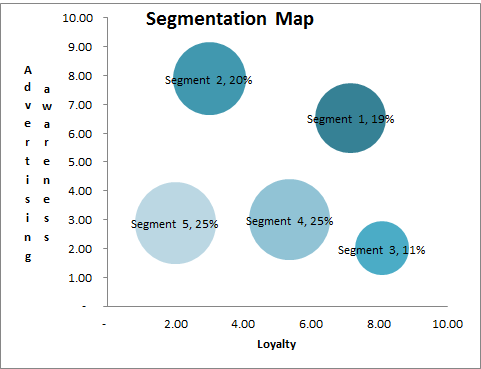
One of the outcomes provided by the free cluster analysis Excel template is a segmentation map – showing consumer preferences – for the first two variables used in the analysis.
When you first look at this segmentation map, it should appear very similar to a standard perceptual map. A perceptual map, sometimes referred to as a positioning map, will map the perceived positioning of various brands or firms in the marketplace from the point of view of the consumer (or target market).
This segmentation map is technically the same, except that it maps the ideal point (or preferred attributes) of the consumers themselves – rather than a brand or firm.
Depending upon the type of data you have used, there are two main ways of interpreting a segmentation map.
If you have entered data related to the consumer
 If your variables include consumer descriptors, and attitude and behavioral factors, such as:
- brand loyalty,
- brand awareness,
- degree of switching behavior,
- various demographics,
- lifestyle factors,
- attitudes and beliefs,
- media consumption, and so on.
Then this style of information is very helpful in developing a segment profile and creating a brand persona. This is because these variables are descriptors of the consumer.
The segments will differ based upon the consumer themselves and will help identify each segment’s similar demographic, psychographic, and behavioral factors.
Segment profiles are very helpful in further describing the target market and helping to develop a better understanding of the consumers – perhaps delivering key marketing insights – and of course, constructing a more effective and successful marketing strategy. Please review this article for more information on segment profiles and this article on brand personas.
If you have entered data related to consumer preferences
If your data includes variables that have asked the respondents about their preferred product attributes and benefits – such as preferred product flexibility, preferred price point, preferred quality, preferred brand strength, and so on – then your information is what the consumer is ideally seeking in terms of product features and benefits.
Therefore, when you review a segmentation map based upon this type of information, you’ll see that it shows the preferred product attribute mix (for the first two variables listed on the free Excel template) for each of the segments. This is ideal information to overlay with a standard perceptual map – the combination of which will form what is known as a “joint space” map.
This allows you to review how effective each brand’s/firm’s positioning is relative to each segment’s preferences. One of the limitations of a standard perceptual map is that it shows competitive positioning, but does not normally show consumer needs. The segmentation map that you have produced visually shows the preferences for each consumer segment. Please note that you can easily construct a joint space map if required, using this free perceptual map Excel template (available on a related website).