This article is a walk-through of how the free Excel template for cluster analysis available on this website works. If you are after formula information for cluster analysis and its variations, please see the external links at the bottom of this page.
If you just need a simple idea of how clustering works for marketing and forming market segments – please see the article: a simple guide to cluster analysis and how it works.
Based on the K-means clustering technique
There are various forms – that is, statistical approaches and formulas – of using cluster analysis. The most basic form is known as K–means cluster analysis. This is the form of cluster analysis used in the Excel template available for free download on this website.
The term “K-means” in cluster analysis simply helps describe the approach. In this case;
- The letter K is the number of segments that will be created. Is it designated as K (a variable) because initially, prior to undertaking the cluster analysis, it is unclear how many segments will be developed.
- And the word means refers to averages. This is because the analysis will provide individual averages/means for each market segment.
- The outcome of k-means cluster analysis is the formation of a number of market segments (where the number of segments = K) that each have their own averages (means).
Multiple K’s provided as part of this Excel template
One significant difference between this template/spreadsheet approach and some other statistical packages is that multiple K’s (number of market segments) are automatically calculated and provided on the same cluster analysis output page.
In most statistical packages, the marketing analyst is required to enter the number of segments (k) that they want to consider (or that they think that there are) prior to running the analysis. In this case, the analyst would need to run cluster analysis a number of times and then compare the various outputs in order to select the most appropriate market segmentation approach.
However, given that the template on this website is primarily designed as a learning tool, the outputs of a two, three, four and five market segment structure are automatically generated. This greatly simplifies the selection of how many market segments are suitable – and allows more time to consider the best mix of marketing variables to include in order to better understand and profile the target market.
The cluster analysis calculation used in the template
A “random” choice of starting points
The Excel spreadsheet calculation starts by “randomly” (please refer to why cluster analysis outputs may vary) selecting a number of individual cases (respondents) to be the proxy center (average/mean) for the market segment. Therefore, when forming four market segments, the spreadsheet will identify four individual respondents to “represent” the market segment.
Please note that this is only the starting point – not the end result. There are multiple revisions (iterations) that keep fine-tuning the market segments until the final market segment output is delivered.
Respondents allocated to the nearest market segment
Once the initial centers of the market segments have been “estimated” (guessed), the cluster analysis process will then allocate every other respondent to the closest one – that is, which one are they most similar to? With a simple data set, then this is quite straightforward. For example, if the data set only included one variable (say customer satisfaction on a scale of 1-10), then it would be easy to allocate respondents to the high or low satisfaction group.
 But because the Excel template can include up to eight marketing variables, we need to use the Euclidean distance to determine the closest segment center.
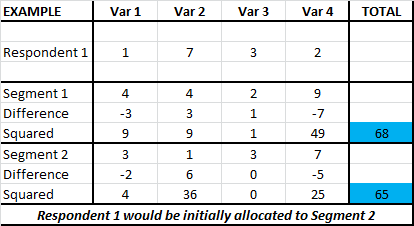
This is shown in this table (click table to enlarge) for respondent 1. In this example there are four marketing variables being used and there are just two market segments (to simplify the example).
The sum of the squared differences between Respondent 1 (and indeed each respondent) is calculated against both Segment 1 and Segment 2. In this example, the respondent is slightly closer to Segment 2 (65 squared distance), than Segment 1 (68 squared distance) – so, at this stage of the clustering process, the respondent is allocated to Segment 2 (although they may be reallocated to another segment later in the process – in another iteration). These numbers (65 and 68) are the sum of squared error (SSE) – please see the separate article on SSE.
This Euclidean distance can be calculated using a “manual” approach as shown in the above spreadsheet excerpt, or more easily by using the Excel formula of SUMXMY2 (which is used in the template).
Segment means (averages) recalculated and respondents reallocated (iterations)
At this stage, all the respondents and their data have been allocated to a specific segment, whichever is deemed to be currently the closest. This now allows for the center (mean/average) of this group of respondents to be re-calculated. This would change the numbers for Segments 1 and 2 above, as they are now based upon a group of respondents – not just an individual.
With this revised information, the above process is then repeated, with respondents being reallocated (if necessary) to a more suitable (that is, closer and more representative) market segment. This in turn would change the center (mean) of each of the segments – in essence, a gradual fine-tuning of the respondents classified to each market segment, as the same process is repeated over and over.
Uses six iterations to determine final market segments
The Excel cluster analysis template on this website uses six iterations (repeated calculations and fine-tuning). Other statistical packages will generally run at least ten iterations and some run even more. But that would be overkill for the size of this template – that is, it only allows you to enter up to 100 respondents and up to eight marketing variables – 800 data points as a maximum – so six iterations is more than enough to generate a good and reliable market segmentation outcome for learning purposes.
More information for the statistically curious
This website is designed to provide a simple guide to cluster analysis for marketers and provides a free, easy-to-use clustering template as a learning tool. The website is not designed to learn the more detailed statistical aspects of cluster analysis. However, if that sort of extra information is of interest to you, then below there are some external resources that you may find helpful.
External Links for Further Detail on Cluster Analysis Calculations
- Statistics information from Dell
- K-means cluster analysis on Excel
- Academic journal link – analysis and interpretation
- Forum response on using Euclidean distance
- History of K-means clustering and a full PDF version of this history article