Introducing the Premium Cluster Analysis Template for Excel
This template is designed to simply and easily run cluster analysis on Excel. It is ideal if you are relatively new to cluster analysis and have access to customer database information or market research survey data.
Although this template was primarily designed with marketers in mind, it will effectively cluster any data.
How does the template work?
The template uses Excel’s built-in “solver” functionality to run k-means clustering, which simply tries to best fit the data into a set number (k) of clusters (or segments for marketers).
It is all automated using a macro, so all you need to do is enter your data and click the button to run the clusters. But then you will need to work with the output to determine the best clustering (or segmentation) approach for your data – don’t worry, please see this article on interpreting the output.
How much data can I enter?
You can enter data for up to 1,000 customers (variables/responses) and up to 20 attributes (descriptors of the data). It has been capped at this amount of data (20,000 data points), as Excel will take 1-2 minutes to crunch through this database.
You can then choose to create between two and ten clusters (segments) using the automated macro (you just click the button).
What if I have more data?
In most cases, you can use a random sample of your data – just in the way that samples are used in market research. Remember that cluster analysis is typically an exploratory technique, where you are looking for insights and trying to understand your data, and then finally to construct meaningful clusters.
Overview of the Excel Template
Here is a video overview of its key features and how to use it, but keep scrolling down for screenshots of the clustering template and more tips on how to use it effectively.
Buy the Premium Cluster Template for just $49
[purchase_link id=”789″ style=”button” color=”green” text=”Purchase”]
The template is provided immediately (a download link for a Zip file to your email) and the purchase is via PayPal (which also accepts credit cards).
Please note: You need Excel 2010 or later to run the macros in the spreadsheet.
Using the Premium Template
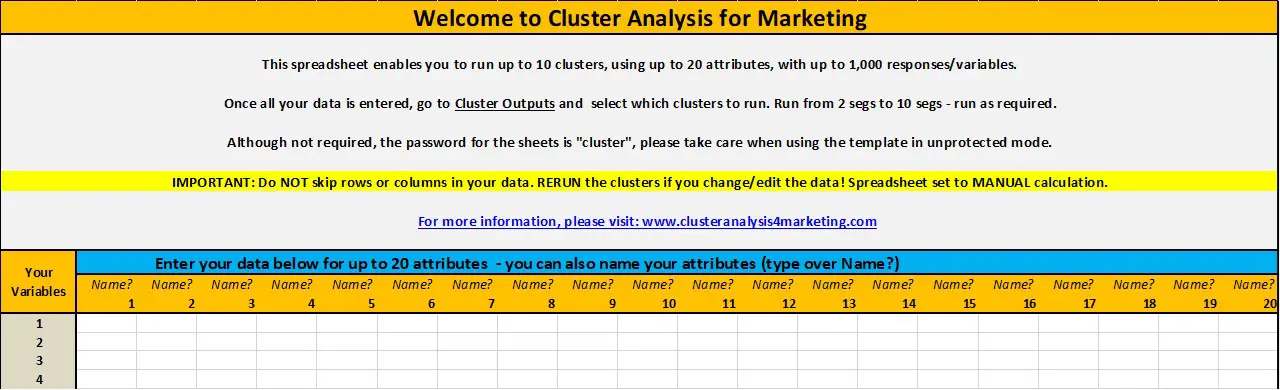
Step One: Enter Your Data
Here is the data entry page, which is where the template will first open. On this tab you enter the names/labels of your attributes (type over Name?) – and then you paste in your data underneath.
Your data can be in any format, as the template will automatically standardize the data.
You will note that the password is listed as ‘cluster’ for each of the sheets. You do not need this password, and it is recommended that you only unprotect the sheets if you are quite experienced with Excel.
Step Two: Run Your Clusters
You then move to the next tab in the template, which is Cluster Outputs. At the top, you will see this menu of buttons. Depending upon the number of clusters that you want to look at, you click that button and the clustering will happen for you.
It will take about a minute to run – you can work outside of Excel at that time if you like – and then the template will tell you when it is finished.

Step Three: Review the Automated Cluster Outputs
There are quite a few outputs automatically produced by the template. These are within the Cluster Outputs tab, but also in Allocation, SSE, Segmentation Maps, and Central Means charts. Have a look around this website for more information on all of these – but here’s a quick summary.
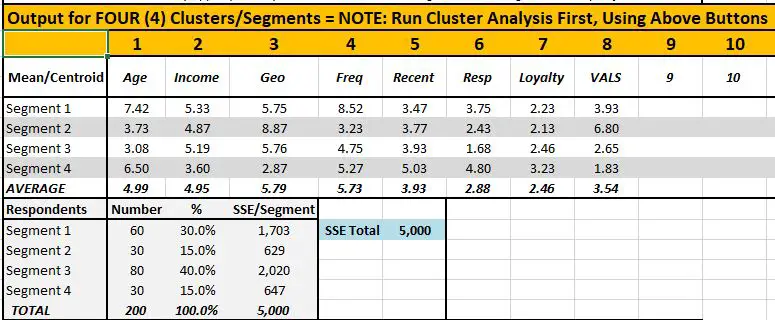
Cluster Outputs
This tells you the mean (average) for each attribute. In this example, there are four segments/clusters. You can see how each of the four clusters differ between each other.
Underneath, you can see the number and percentage of respondents allocated to each cluster, along with the total SSE and SSE by segment.
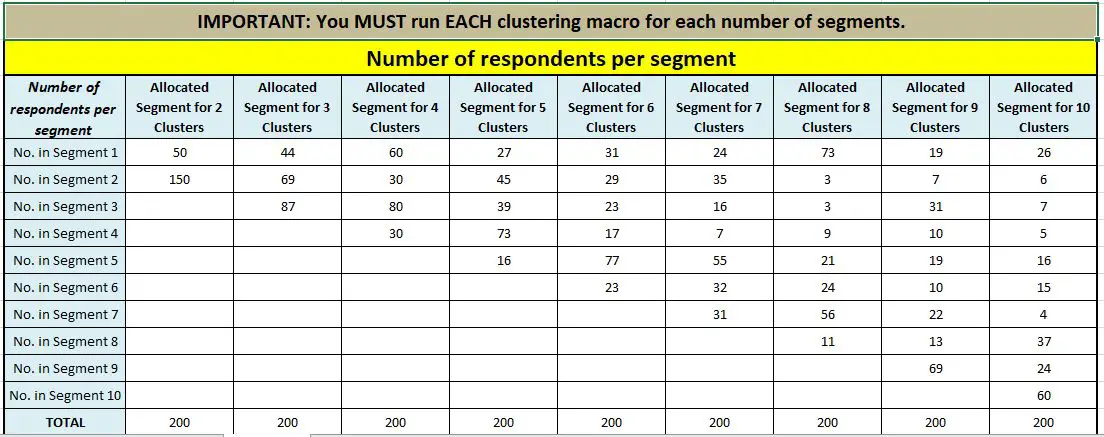
Allocation
This tab provides information on the number of customers/variables allocated to each cluster, for each configuration (number of clusters). Underneath this table you will also find to which cluster (for all configurations) that each customer/variable has been allocated to by the Excel clustering algorithm.
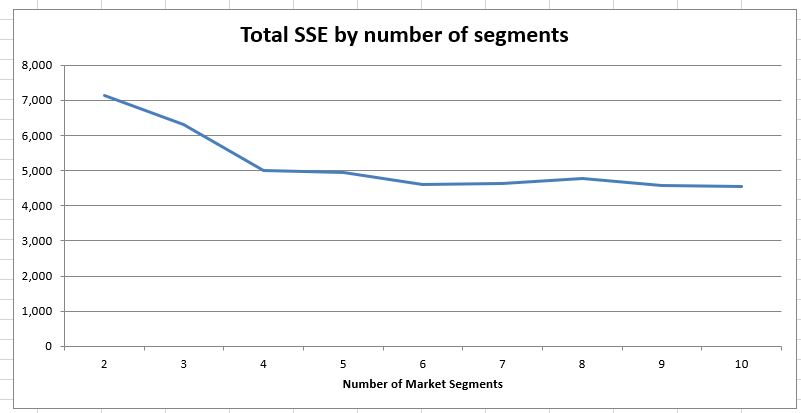
SSE
There are two charts on this tab, graphing SSE across cluster runs, as well as split by segment. This is very helpful information for choosing the most appropriate number of clusters for your data.
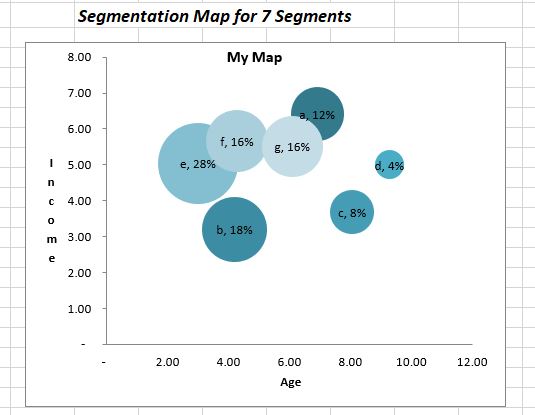
Segmentation Map
This allows you to map (graph) any two attributes and show the size and position of each segment – an helpful analysis tool.
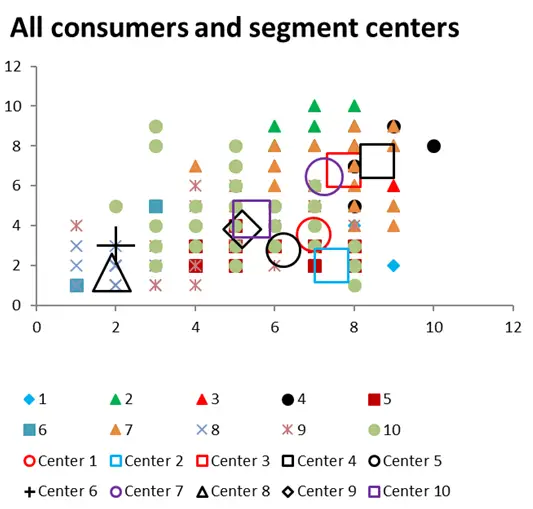
Central Means Charts
On this tab, you can again choose any two attributes to graph. This will show every customer (variable) and where they sit versus the mean for the cluster, for these two attributes. Again, this is a helpful interpretation and analysis feature in the template.
Free Mini Template
Please note that there is a free template provided on this website is designed for use by students and their instructors to help understand the concept of converting data into clusters and then into market segments. For this version, the maximum number of cases/responses has been capped at 100, and it has less built-in features. See the differences between the clustering templates on this page.
Try Before You Buy
Here is a sample of the template – without the clustering macros – so you can have a look at the template and its outputs, to see if it is right for your segmentation needs. Click here to download the premium-cluster-analysis-marketing-Excel-template-SAMPLE
Buy the Premium Cluster Template for just $49
[purchase_link id=”789″ style=”button” color=”green” text=”Purchase”]
The template is provided immediately (a download link for a Zip file to your email) and the purchase is via PayPal (which also accepts credit cards).
Please note: You need Excel 2010 or later to run the macros in the spreadsheet.