Example of using the template to create market segments
This is designed as a fully worked example of how to use the free cluster analysis Excel template on this website to form market segments. It uses the same sample data that is included with the spreadsheet when you download it – so it is easy for you to review the same results.
The sample data used
For this worked example, just 20 respondents have been used – to help make the example easy to follow – with individual data for four marketing variables, namely: loyalty level, level of advertising awareness, product usage level (that is, heavy-light user), and sales promotion responsiveness.
The data was scaled from 1-9, with 1 being very low and 9 being very high. The data for these types of marketing variables would have been obtained from a customer database (for loyalty and usage level) and then combined with results from a market research survey of customers (to add advertising awareness and level of sales promotion responsiveness).
Review the cluster analysis outputs
Once the data has been generated, the outputs of the cluster analysis will be automatically produced.
Start with SSE
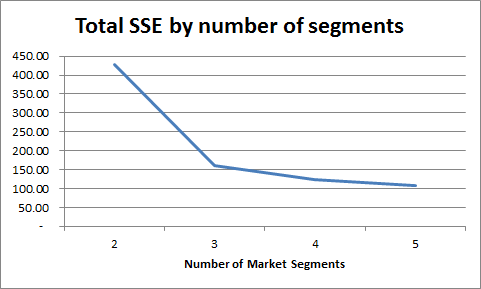 Probably one of the first outputs that you should consider is the sum of squared error (see this article for more information on SSE). The goal here is to avoid a segmentation approach with a high SSE and look for a smaller (not necessarily the lowest) sum of squared error.
As a simple rule of thumb, the greater the number of market segments, then the smaller the SSE – which is the case in this example. Looking at the graph of SSE, you would look to avoid the two segment approach and look to use either the three, four or five segment structure.
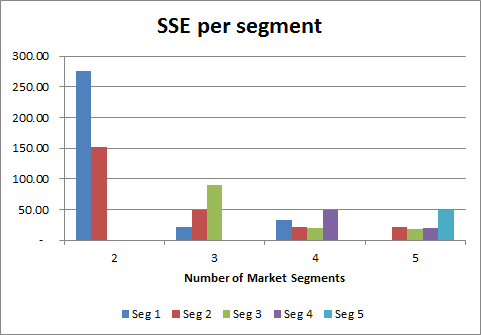 However, when we look at how the error is spread across the different market segments, we can see that the four and five segment structures have been more successful in creating segments with similar consumers.
The three market segment structure has a higher SSE for segment three in particular (indicating a degree of dissimilarity), whereas the four and five segment structures are more balanced – which indicates that these segments appear to work better for the data we have used.
Next we look at the segmentation maps
Please note that the segmentation map only maps the first two variables listed on the input page – in this case loyalty and advertising awareness – however, it is a helpful visual tool for understanding the segments and where they sit relative to each other.
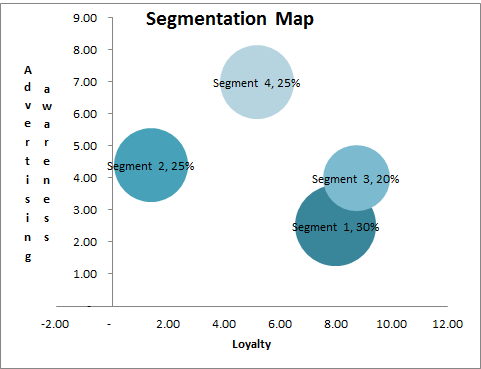 The first segmentation map – for this example – that we will review is for the four market segment structure, as shown here.
This map highlights a potential concern – that Segment 3 appears to be a sub-set (or a niche segment) of the larger Segment 1. So we will need to understand how they differ – that is, why the cluster analysis process has split them into two market segments? We can do that in the next step (note: it is likely to occur as the graphs only show two marketing variables, whether the data is classifying the segments on all four variables).
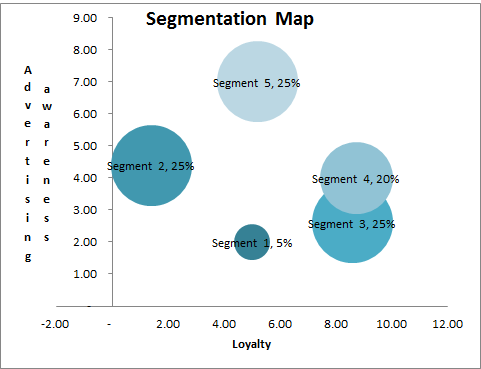 While we are reviewing the segmentation maps, we will also look at the one showing the five segment structure, as shown here.
This looks like it has a little better structure to the market segments – although we are relying upon the first two marketing variables only – these segments are more distinctive and spread around the map – the overlap of the two segments is still evident, but with an extra segment being identified.
So, at this stage, perhaps the five market segmentation approach seems to be the most suitable, but we should look at the means (centers) of the marketing variables as the next step anyway.
Review the “output clusters” worksheet
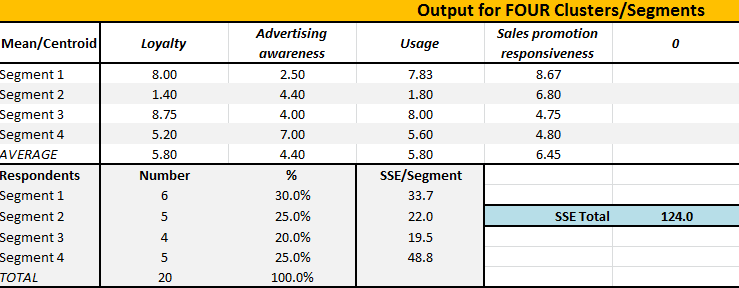 Now we switch from reviewing graphs (a visual check) to now reviewing the cluster analysis output in table form. The output for the four segment approach is shown first.
We have already checked the SSE score in comparison (on the graph – see above), so we don’t need to recheck that information.
We should first have a look at the segment sizes – the percentage of respondents allocated to each segment. What we would like to see that there is a good distribution of respondents across the segments, which appears to be the case for this example. We wouldn’t want 85%of respondents allocated to just one market segment and the balance of 15% allocated to the remaining segments. So these segment sizes appear to be quite suitable for use.
Then we should try to make sense of the means (centers) of each of the marketing variables for each of the proposed market segments. Do they make sense? Can we describe each of the market segments? (Please refer to creating market segments for more information.)
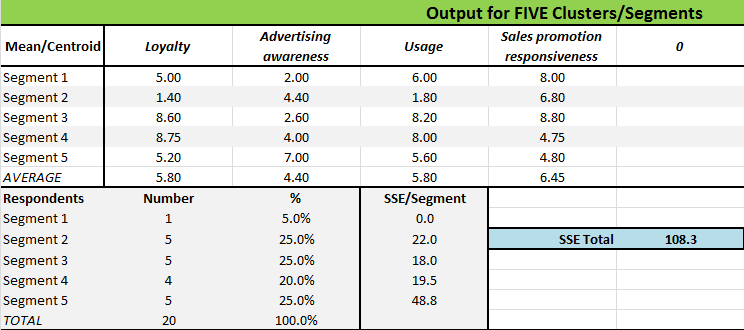 Obviously, we would repeat this process of reviewing segment sizes and thinking about the underlying marketing logic of the proposed segments for the five segment structure as well. This output table is shown here for information.
Important note: remember that these (the four and the five market segment structures) have been calculated independently – which means that there is no direct relationship between Segment 1 in the four segment approach and in the five segment approach – so please do NOT compare segments between segmentation approaches.
At this point, we would review the five segment approach in the same manner as we did above with the four segment structure. Again we see a good distribution of respondents across the segment membership – so let’s now move to describing and understanding the segments, as discussed immediately below.
Understanding the segment structure
As mentioned in the previous section, we need to get a sense of the market segments – what are their main characteristics and in what ways are they similar and different to the other segments?
For this step we will use the centroids/means output for each segment for each marketing variable – as shown in the tables above. Starting with the four market segment approach, we can conclude:
- Segment 1 has high/above average loyalty and product usage and are very responsive to sales promotions, but are largely unaware of advertising. This indicates that this high value segment can be retained and grown via various sales promotion incentives
- Segment 2 appears to be a very low usage segment, with little/no loyalty that can be motivated for purchase by attractive sales promotions
- Segment 3 is well above average for loyalty and usage – yet below average for advertising awareness and response to sales promotion – indicating long-term loyalty that is hard to shift.
- Segment 4 has medium/average loyalty and product usage, but are reasonably aware of advertising – indicating that their loyalty and usage may be influenced via advertising
If we were to give each of these segments a descriptive name (to make it easy to recall their characteristics), we might come up with something like:
- Segment 1 = Very loyal, so reward me
- Segment 2 = Occasional buyers, if the deal is right
- Segment 3 = Loyal and beyond marketing influence Occasional buyers, if the deal is right
- Segment 4 = Medium buyers, but I’m listening
For more information, please refer to segment nicknames and to segment profiles.
Then we would repeat the same process for the five market segment structure – and skipping straight to the segment names, we would find this segmentation approach:
- Segment 1 = Medium buyers, so what’s the deal?
- Segment 2 = Occasional buyers, if the deal is right?
- Segment 3 = Very loyal, so reward me
- Segment 4 = Loyal anyway and beyond marketing influence
- Segment 5 = Medium loyalty, but I’m listening
Please note that while there are some similarities between the two segmentation approaches – it is not just a case of splitting one segment into two to form an extra market segment – which indicates the need NOT to compare segments between approaches.
Play around with the marketing variables
There is no reason not to vary the marketing variables that you use. In this example, you could start thinking that brand loyalty and product usage level are somewhat similar and may measure the same consumer attitude/behavior. Therefore, you might want to take product usage level variable out completely and then recheck the cluster analysis outputs – just for example, but play around with different variables, it’s quite worthwhile.
Related topics
Interpretation of cluster analysis outputs
Criteria for effective segmentation
Another example of turning data into segments – please see the below video…