Using the segment sizes in cluster analysis
 Another very worthwhile output from the free Excel cluster analysis template is the size of each of the market segments. This information will come in handy for estimating the total size of each segment, as well as its financial viability for the firm.
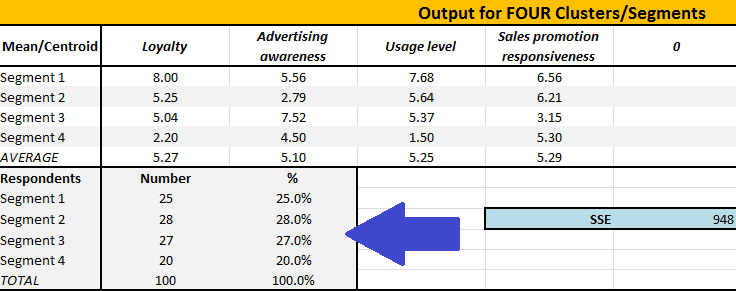
This information is shown on the output page – right below the averages for each marketing variable, as shown in the diagram.
For this same example, we can see that 25 respondents have been allocated to Segment 1, 28 to Segment 2, and so on. Because, in this example, there are 100 respondents, the percentage of the total market per segment is the same (e.g. 25%, 28%, and so on).
You need to use the percentage column only for your further analysis. You can then apply this percentage to the total market size to estimate the size of each segment.
Example of estimating market segment size
In this example there are 25% of the respondent allocated to Segment 1. If, for example, there were 1,000,000 consumers in this market – then we can estimate that 250,000 of these consumers belong to Segment 1.
If we also have access to average purchase quantities and average price, we can also estimate total volume and revenue for each market segment (note: you may/may not have access to this information, but it is very helpful in determining market potential when selecting target markets). For the purposes of this example, let’s assume that the average purchase quantity is 10 per year and the average price is $5.00 – then we can calculate the following:
- Total market (number of consumers) = 1,000,000
- Total market volume = 10,000,000 units (average purchase quantity 10 X 1,000,000 consumers)
- Total market value (revenue) pa= $50,000,000 (10,000,000 units X $5 average price)
And as Segment 1’s 25% share, we can calculate the size and value of the segment as:
- 250,000 consumers
- 2,500,000 unit volume
- $12.5m segment value pa
Related topics