Contents
Sum of Squared Error (SSE) in Cluster Analysis
 Sum of squared error, or SSE as it is commonly referred to, is a helpful metric to guide the choice of the best number of segments to use in your end segmentation.
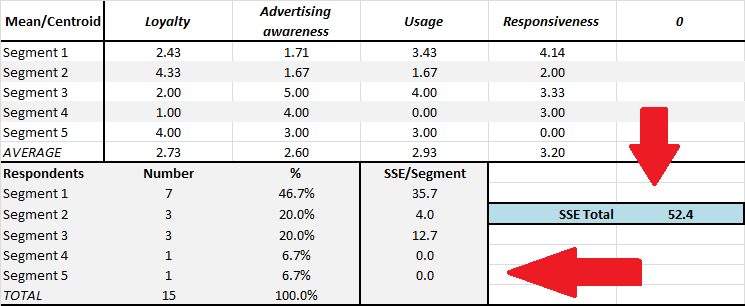
As the free Excel cluster analysis template automatically provides the output for two, three, four and five market segments – you need to choose the most appropriate number of segments for your marketing situation – and SSE will help you do that to some extent. Please check this diagram for where to locate the SSE scores on the Excel template – plus there a separate worksheet in the template that has two SSE charts for quick reference.
What is sum of squared error (SSE)?
Cluster analysis is a statistical technique designed to find the “best fit” of consumers (or respondents) to a particular market segment (cluster). It does this by performing repeated calculations (iterations) designed to bring the groups (segments) in tighter/closer. If the consumers matched the segment scores exactly, the the sum of squared error (SSE) would be zero = no error = a perfect match.
But with real world data, this is very unlikely to happen. So we need to look for a segmentation approach that has a lower SSE. The lower the SSE, then the more similar are the consumers in that market segment. A high SSE suggests that the consumers in the same market segment have a reasonable degree of differences between them and may not be a true (or usable) market segment.
Please note that you don’t need to select the segmentation approach with the lowest SSE, but it should be one of the lower ones.
Using SSE: An example (for SSE by Number of Segments)
 To make sense of what to look for, let’s consider the following sum of squared error outputs:
- With two segments = 1,629
- With three segments = 1,163
- With four segments = 948
- With five market segments = 854
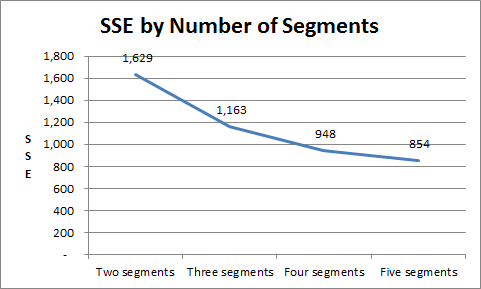
To further clarify, let’s have a look at these sum of squared error (SSE) outputs on a graph, as shown here. (This SSE chart is automatically produced by the template – you will find it on a separate worksheet – please see the tabs at the bottom of the spreadsheet.)
As you can see, as more market segments are created the SSE improves. This is generally to be expected. For example, if we had 100 consumers allocated to 100 different market segments, then the SSE would be zero – but, of course, it becomes impractical for a firm to pursue 100 market segments and, as well, each market segment would be too small to be viable.
Therefore, we need to accept a degree of error – (where “error” simply means that the consumers in each market segment are not completely identical, they will vary to some extent in terms of some of their behaviors and psychographic factors).
In this example, we would rule out the two market segment structure, as its SSE is too high relative to the other potential approaches – it is almost double the error of the five segment approach for instance.
The three segment approach offers a big improvement in minimizing SSE, but then the level of improvement starts to decrease (as to be expected) with each increment. I would suggest, that in this example, either the four or the five market segment structure would be suitable.
We also look at SSE per segment
 While the previous SSE chart is quite helpful for looking at the overall “accuracy” of each of the segment structures to classify consumers, it is also worthwhile to consider the individual sum of squared errors for each segment. (Note: The sum of the individual segment SSE’s is equal to the total SSE.)
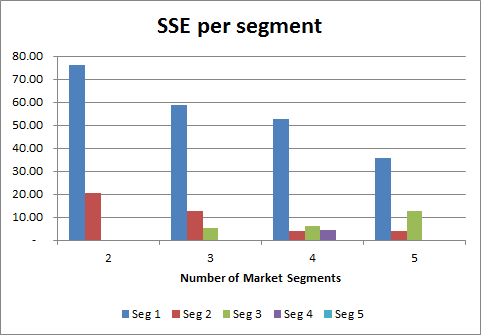
This information – SSE by segment – is available in both the “Output Clusters” and in the SSE charts worksheet, as shown here.
The lower the SSE, then the more similar (homogeneous) the consumers are in that market segment. If we look at the graph, we can see that segment one has a large SSE result across all segmentation structures. This indicates that there is some dissimilarity between the consumer in this market segment – and perhaps could be better defined?
However, the low SSE scores for the other segments indicate strong similarities between the consumers in each segment for the marketing variables being considered. For a segment with a SSE of zero – then that will be a segment of one consumer, or of identical consumer responses according to the data we are using.
Our final market segmentation decision
We would then make our final decision by also considering the marketing logic of these segments – look at the segmentation map and the average of each marketing variable – which one makes more sense based on what we know about the market and which one would be easier to construct a market strategy that would be successful?