Contents
Creating and understanding the market segments
The starting point to have run cluster analysis using the free Excel template available in this site – take me to the download page.
Review the averages (means) of the marketing variables for each market segment
A key outcome of the cluster analysis template is the average (mean/centroid) of each marketing variable for each segment structure – with this Excel template providing the averages from two up to five market segments.
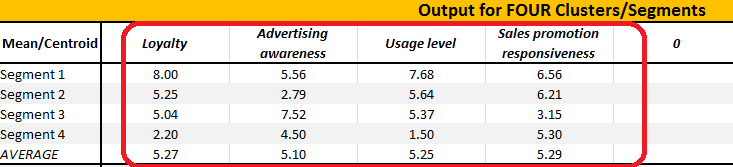 To help explain what these averages (mean/centroid) are telling us, let’s look at the example output for four segments, as shown in this diagram.
You should see that there are four marketing variables used – namely, loyalty, advertising awareness, product usage level (that is, heavy, medium, light, non-user) and level of responsiveness to sales promotions. These are the four marketing variables – which are all behavioral forms of segmentation – used in the cluster analysis calculation to create the four market segments in this example.
The numbers shown are the average (mean) for all the consumers allocated by cluster analysis to a particular segment. For example, segment 1 has an average score of 8.0 for loyalty, 5.56 for advertising awareness, 7.68 for level of product usage, and 6.56 for sales promotion responsiveness. In the market research survey that was used for this example, the data was scaled on a 1-9 basis – where 9 is very high and 1 is very low.
Please note that at the bottom we have the “average”, which is for all consumers across all market segments. We can use this average for comparison, as well as using the scores generated for each of the other market segments.
Let’s have a closer look at segment 1
This market segment has a score of 8.0 for loyalty. Remember that the maximum is 9.0 (minimum of 1.0), so we can see that this is a high level of loyalty on the scale. We can then compare this loyalty score to the average of the total market, which is 5.27 – and we can see that the 8.0 score is well above the market average. And we can also compare this segment’s loyalty score against each of the other segment scores – of 5.25 (for segment 2), 5.04 (for segment 3), and 2.20 (for segment 4). Again we can see that segment 1 has a much higher level of loyalty. Therefore, we can conclude that the high loyalty level for segment 1 is clearly an important and distinguishing factor in understanding the segments that have been initially generated.
We can then continue the same comparison process for the other three marketing variables – and we can then conclude the following about segment 1 and their behavioral characteristics:
- The segment has a high level of loyalty
- It has an average level of advertising awareness – with other segments either being higher or lower
- Segment 1 has a high level of product usage
- And the segment is quite responsive to sales promotions (short-term sales incentives)
In summary: This information indicates that this segment consists of heavy users who are quite brand loyal. They have a reasonable level of advertising awareness, but can be more influenced by sales promotions. The combination of loyalty, usage and sales promotions suggests that they will buy their regular brand in larger quantities in response to a sales promotion, but are unlikely to switch for a competitive offer.
Summary for segments 2, 3 and 4
We then repeat the same comparison method for the remaining three market segments to find:
Segment 2
- Loyalty level = average
- Advertising awareness = low
- Product usage level = average
- Sales promotion responsiveness = high
In summary: This indicates that this is a market segment that is a regular purchaser (average usage), that is willing to switch on occasions (average loyalty) and are usually influenced by sales promotions rather than advertising.
Segment 3
- Loyalty level = average
- Advertising awareness = high
- Product usage level = medium
- Sales promotion responsiveness = low
In summary: This indicates that this is a market segment that consists of regular purchasers with an average usage, who are willing to switch on occasions (due to average loyalty) and are usually influenced by sales promotions rather than advertising.
Segment 4
- Loyalty level = very low
- Advertising awareness = below average
- Product usage level =very low
- Sales promotion responsiveness = average
In summary: This combination of behavioral factors suggests an occasional buyer who moves in/out of the market as a purchaser depending upon attractive deals (sales promotions). This segment could be helpful in achieving short-term sales targets, but is unlikely to become a valuable long-term loyal customer.
Related topics
A worked example: from data to market segments
Free download of Excel cluster analysis maker
Sum of squared error (SSE)