Contents
- 1 A step by step guide to using the free cluster analysis Excel template
- 1.1 To use the cluster analysis Excel template – please follow these steps
- 1.1.1 Step one – download the free template from this website
- 1.1.2 Step two – add the ‘Solver add-in’ to Excel (optional step)
- 1.1.3 Step three – enter your marketing data
- 1.1.4 Step four – review the results/outputs of the cluster analysis
- 1.1.5 Step five – also review the cluster analysis graphs
- 1.1.6 Step six – play around with the data
- 1.1.7 Step seven – select the best segmentation approach
- 1.1.8 Step eight – copy/note the required information
- 1.1 To use the cluster analysis Excel template – please follow these steps
A step by step guide to using the free cluster analysis Excel template
Please note that this cluster analysis Excel template has primarily been designed for the purpose of teaching marketing theory and concepts, however it can be utilized by other disciplines provided that suitable data is available.
Important: To use this template you will need to use an Excel spreadsheet – it should run on any version of Excel.
To use the cluster analysis Excel template – please follow these steps
Step one – download the free template from this website
![]() Go to the page on this website where the download link is available. It is labelled “free download” in the top menu – which is shown by the big red arrow in this diagram – or you can click here to go to the download page (remember to come back here to keep reviewing this how-to-use guide).
Go to the page on this website where the download link is available. It is labelled “free download” in the top menu – which is shown by the big red arrow in this diagram – or you can click here to go to the download page (remember to come back here to keep reviewing this how-to-use guide).
There are some simple instructions on the download page – but basically you need to:
- click the download link
- open the file in Excel
- enable editing
- enable macros
Step two – add the ‘Solver add-in’ to Excel (optional step)
There are instructions in the spreadsheet on how to do this. Solver is an included feature of all versions of Excel (including student editions) – but you will need to “turn it on”. Solver runs the calculation for the cluster analysis and the spreadsheet will not work without it.
Once you have followed the built-in instructions and then EXITED and reopened the template spreadsheet, then you are good to go and start your clustering.
Step three – enter your marketing data
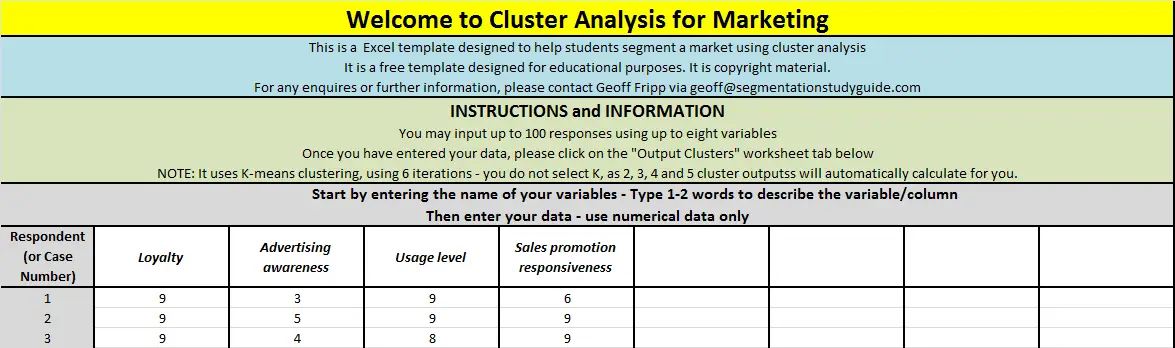 When the Excel template first opens, You should see this page/worksheet when you open the spreadsheet – it should read “Welcomes to Cluster Analysis for Marketing”, as shown in the image.
There are instructions on the spreadsheet template as well – but you should only enter data in the white spaces.
- Start by entering the names of your variables across the top – try to use only one or two words only – such as “loyalty”, “advertising awareness”, “usage level” and “sales promotion responsiveness” and so on.
- Then you should enter your data in the corresponding columns. Note: You can type in your data or you can copy/paste it in from another spreadsheet.
Please review the article on what data you should use for cluster analysis if you are unsure – as a simple rule, do not use nominal data (such as male = 1, female = 2). Ideally, your data should be in an ordinal or interval scale form. For example, if you have income data, try and code it on a scale basis – such as, since it’s such as $20,000-$30,000 = 1, $30,000-$40,000 = 2, and so on.
Important note: You should put your two most important variables in the first two columns, as these will be the variables that are automatically mapped by this template – the clustering template will produce a segmentation map for the segments, as well as a central means graph for the individual consumer data – please review the article on how to interpret the data for more information.
Step four – review the results/outputs of the cluster analysis
 Once you have entered your data, the clusters will automatically calculate – there is nothing else for you to do. You can now review the cluster analysis output by clicking on the appropriate worksheet tab at the bottom, as shown in the following diagram.
When you click on “Output Clusters”, you should see a page that says “Cluster Analysis (Segmentation) Output.
Please note that there are four output tables for you to review. Normally, when you run cluster analysis you predetermine how many clusters or segments that you would like to see. However, this particular Excel template will calculate the outcomes for two, three, four and five segments all at the one time for ease of use.
Important note: You should end up only using one of the output tables – that is, only one market segment structure (that is, either two, three, four or five market segments) – choose the one that makes the most sense based upon your understanding of the marketplace and the data – please see the articles on forming market segments and selecting target markets.
Step five – also review the cluster analysis graphs
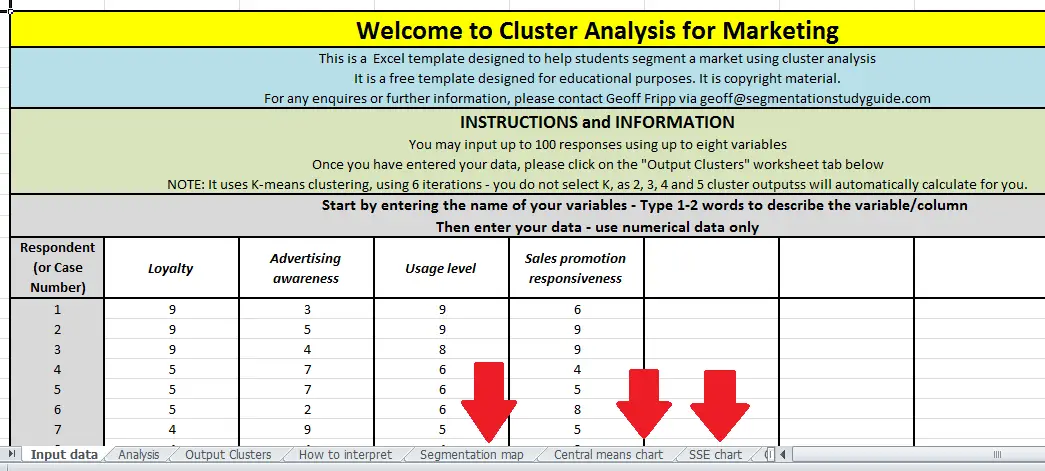 There are three sets of graphs provided automatically by this clustering template. Again, simply click on the appropriate tab – either segmentation map or central means graphs or SSE chart to review.
Please review the articles on how to interpret the graphs for more information: segmentation maps, central means graphs, SSE chart.
Important note: Because graphs are two-dimensional, only the first two variables will be shown on the charts.
If you want to undertake further mapping, please visit Perceptual Maps (a related website) that provides a free perceptual mapping template to use – and review the article on perceptual maps and joint space maps.
Step six – play around with the data
You are unlikely to have immediate success in finding the ideal market segments structure. Generally, a marketing analyst would use different variables – that is, add some variables to the analysis, take some out, and so on.
Do not be concerned if it takes a few variations of the data and variables to get a market segmentation that makes sense to you. This is a normal part of analysis and is to be expected. Please see the cluster analysis example article for more information regarding this approach.
Step seven – select the best segmentation approach
Having spent some time playing around with the data in step five, you will probably have a version of variables that deliver a logical approach for your firm/brand in terms of market segments and also make sense in terms of the different segments – so you will be able to describe them, profile them, and develop a suitable marketing strategy.
Please see the article on creating market segments for more information on how to do this step.
Remember to only pick one of the outputs – that is, either the two, three, four or five segment approach. (Although you are limited on the charts/graphs to two variables only, which should be your most important variables –the data for the other variables is still available in the cluster outputs table).
Step eight – copy/note the required information
In most cases the identification of suitable market segments from consumer data will be the starting point of either segment profiling or the selection of suitable target markets (click the links for more information).
In either case, the data provided by this cluster analysis template should prove helpful in adding to your final reports or further analysis.
Related topics
How to use the template videos
Cluster analysis: a worked example
Interpreting the cluster analysis outcomes
Understanding the concept of cluster analysis